|
|
|
|
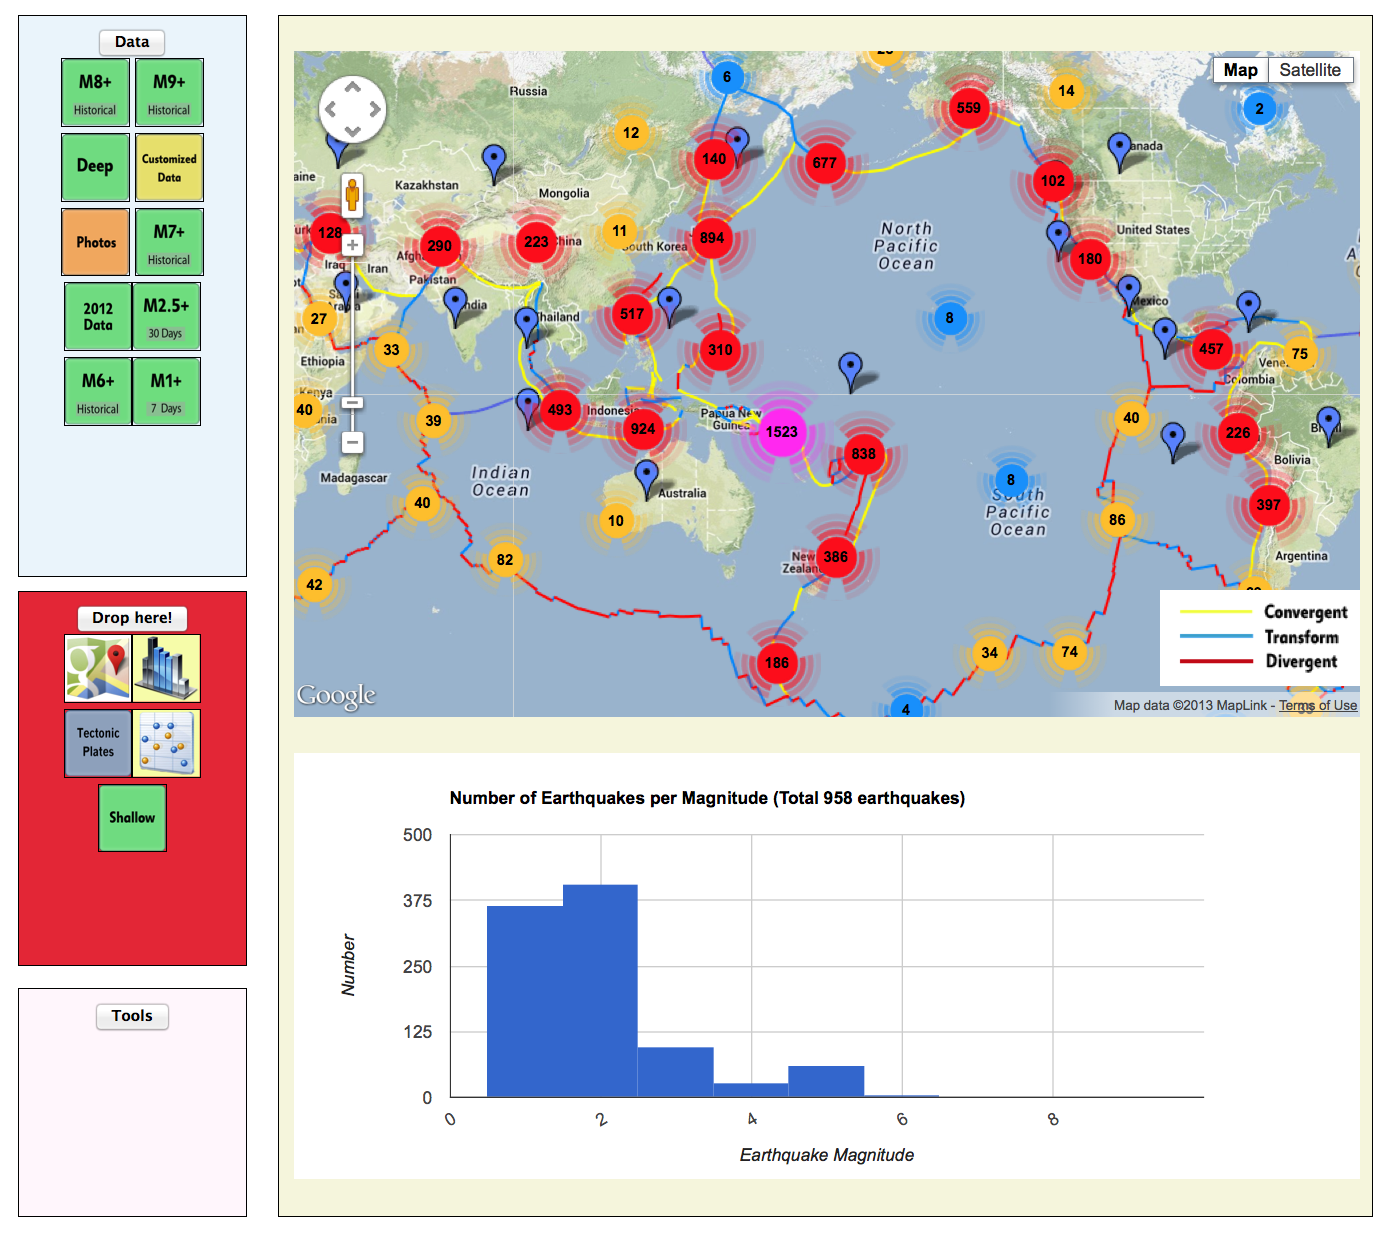
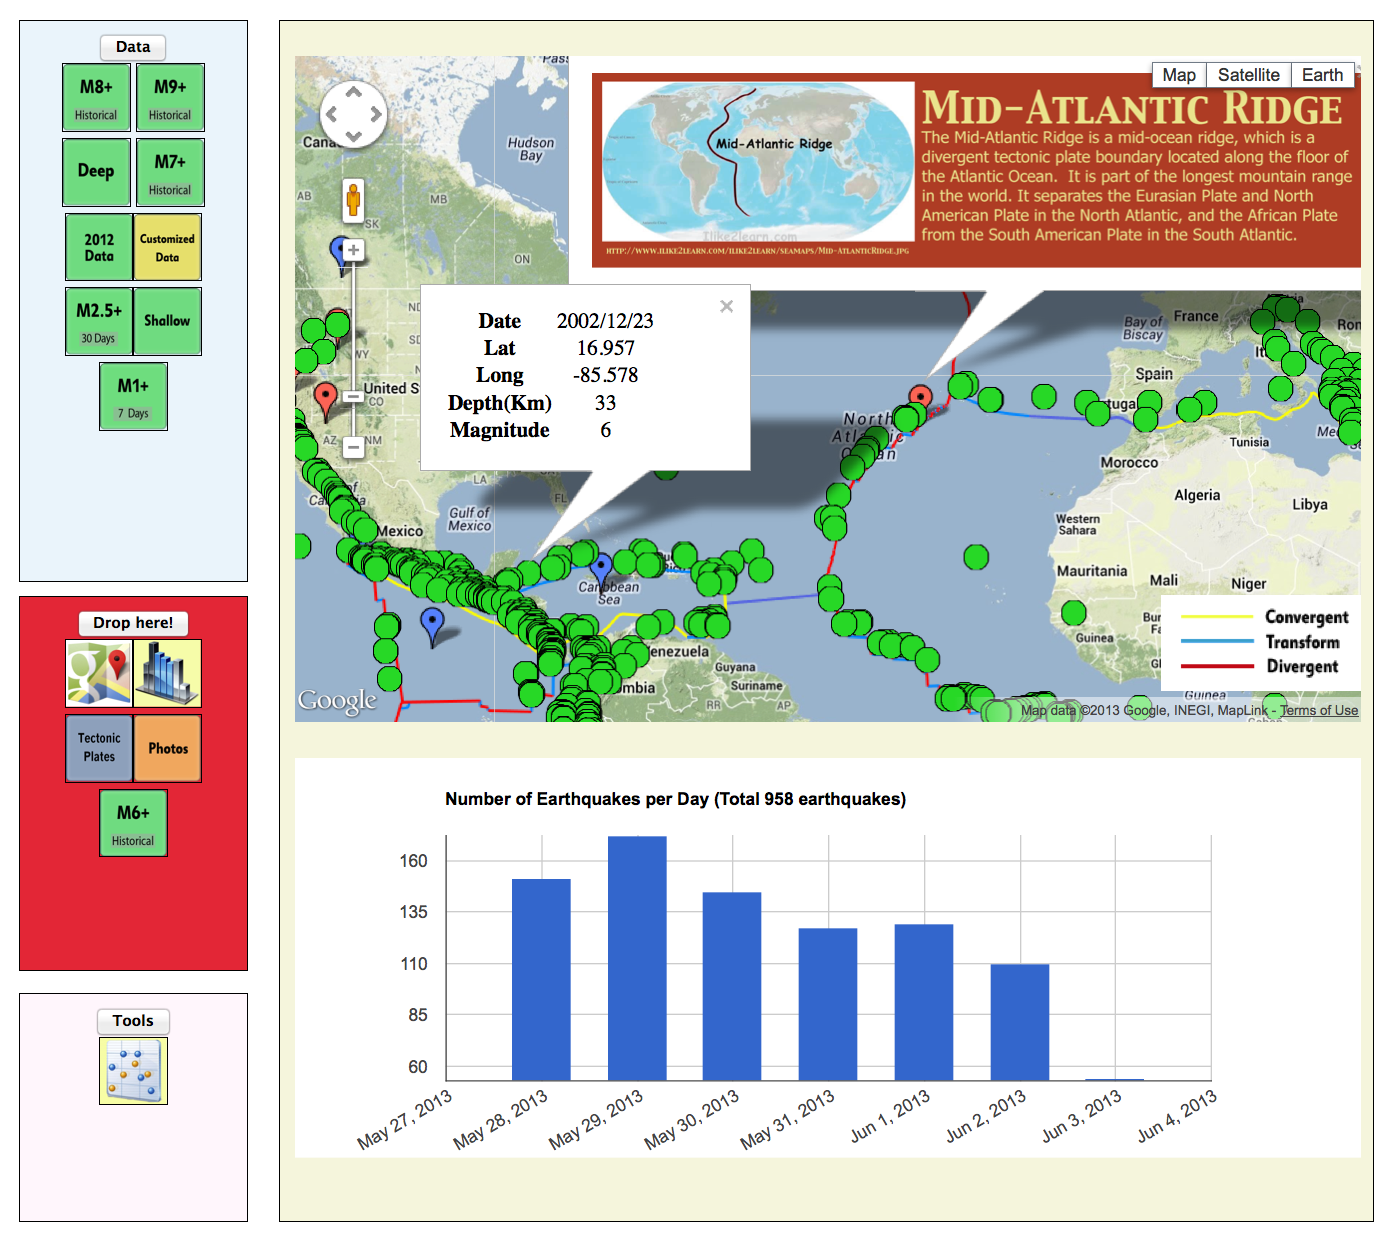
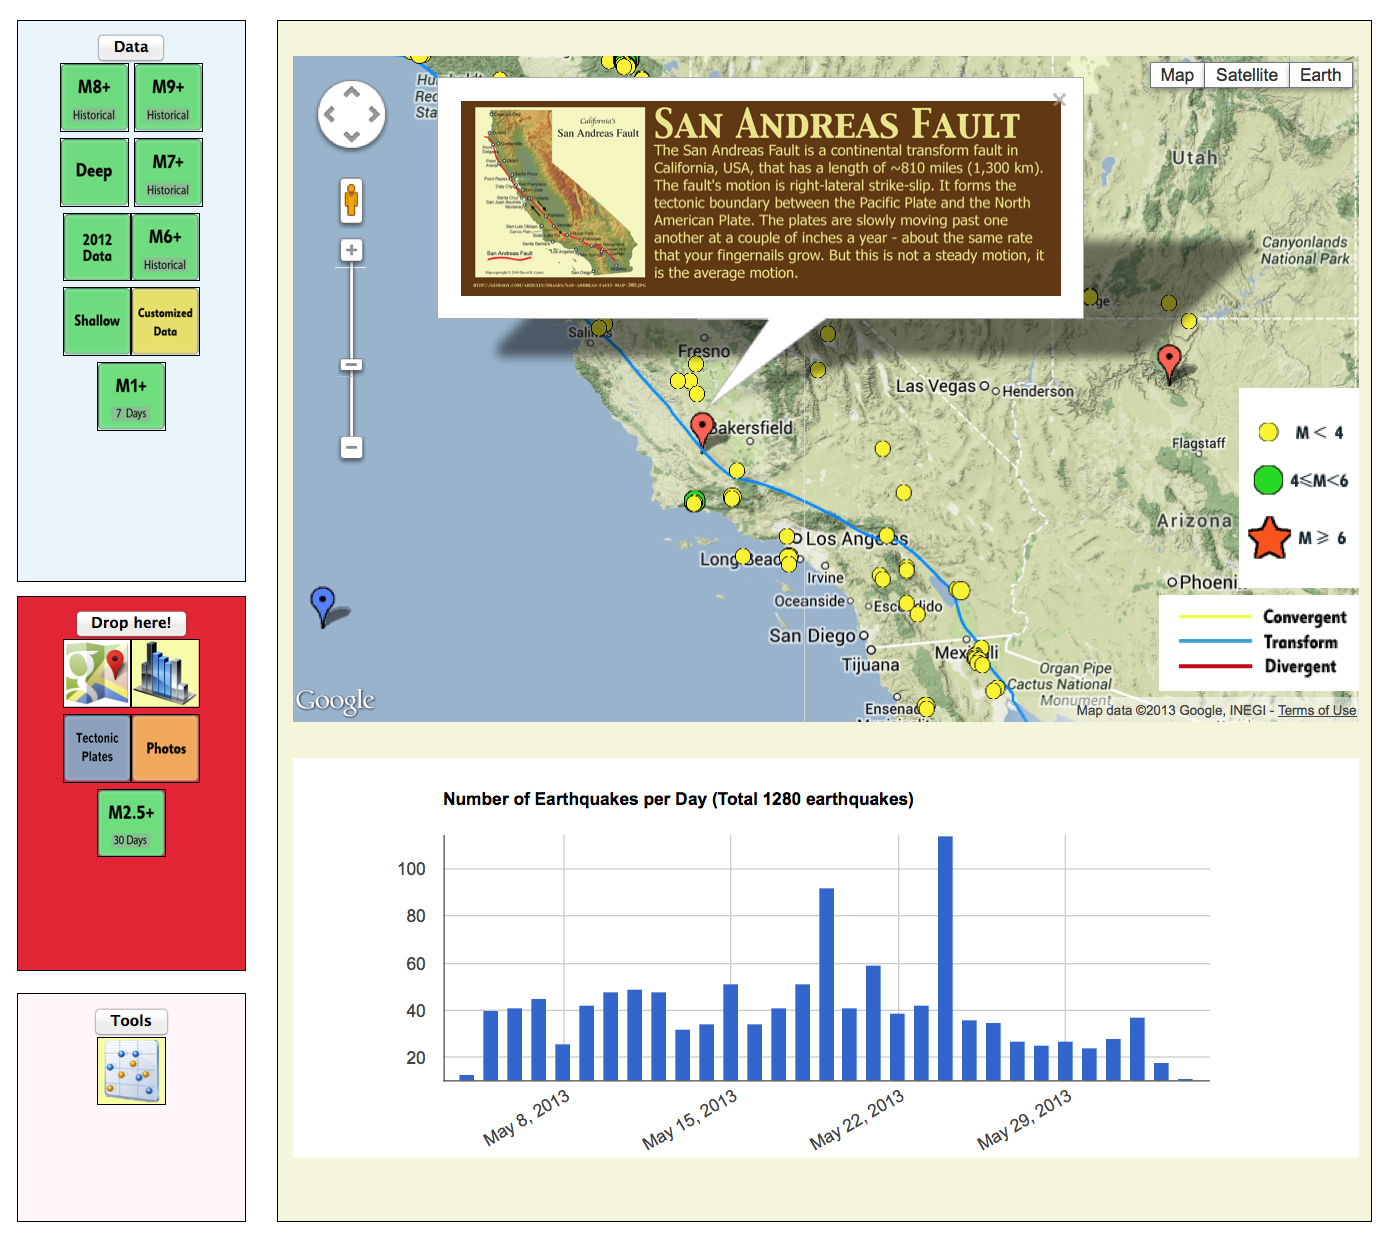
The Seismology data visualization tool to explore real-time earthquake data as a function of time, magnitude and depth. This interactive tool displays real-time earthquake data from the USGS and historical data from 1898 to 2012. Users can also juxtapose plate tectonic boundaries, geologic imagery, and display their own data using a GoogleDoc interface. This tool is designed for people to have quick access to earthquake data and provides the ability to customize and share data without additional software. Official Website |